
The problem
Most analytics tools produce more charts than decisions. Teams spend their week maintaining dashboards, then guess what a drop in activation actually means.
Product analytics without the dashboard sprawl.
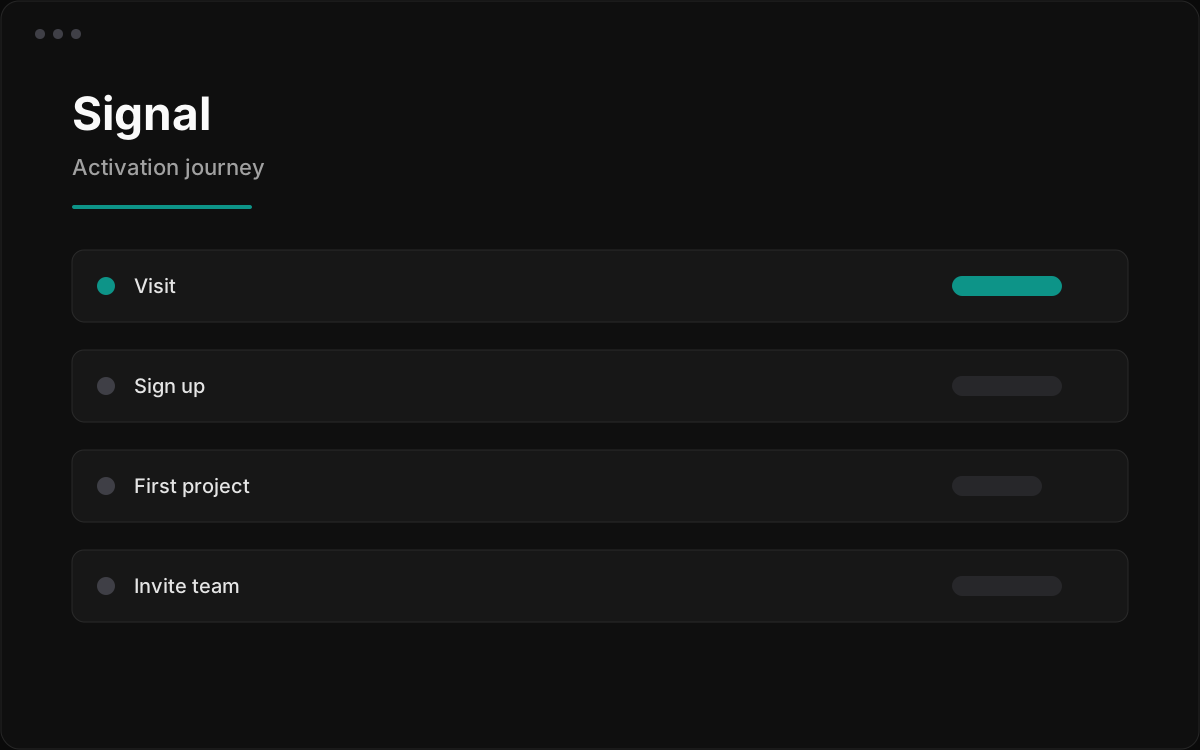
Signal follows the few journeys that matter, explains changes in plain language and tells the team where to look next.
This product is a placeholder while we finish the real launch content. Details and screenshots will change.
Most analytics tools produce more charts than decisions. Teams spend their week maintaining dashboards, then guess what a drop in activation actually means.
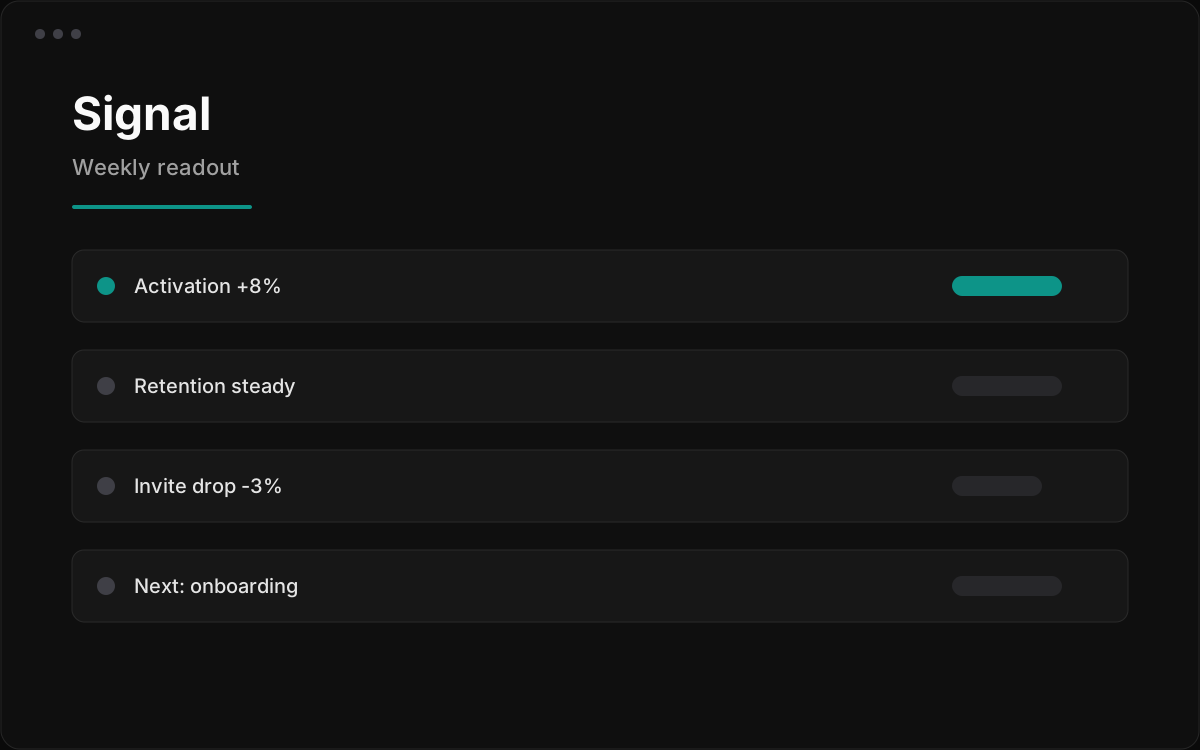
Signal starts from a small set of product journeys, watches them continuously and writes a short weekly readout. When a metric moves, the team sees the change, the likely cause and the next question to ask.
01
Define the handful of flows that matter and track them without rebuilding charts every sprint.
02
A short summary of what moved, what changed around it and what deserves attention.
03
Alerts connect metric shifts to releases, segments and nearby funnel steps.
04
Aggregate events, configurable retention and no third-party ad tracking built in.
Early interface previews. Final screens may change before launch.
Tell us what you are building. We usually reply within two business days.